Vue3实现DAG有向无环图
2023/7/7 VueVue3
# 前端图形库调研--流程图相关
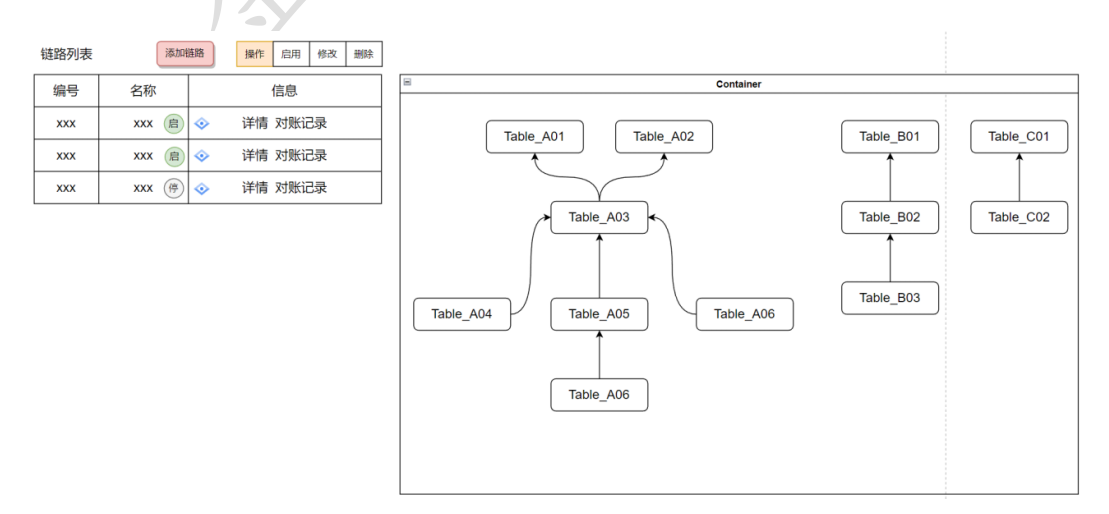
需求:quanlianluduizhang 一期优化中有这样一个需求,要求根据左侧列表关系实现右侧图的展示。如下图:
 根据以上需求,前端共调研了三种技术去实现,分别为:AntV X6 的 DAG 有向无环图、D3.js、AntV G6。
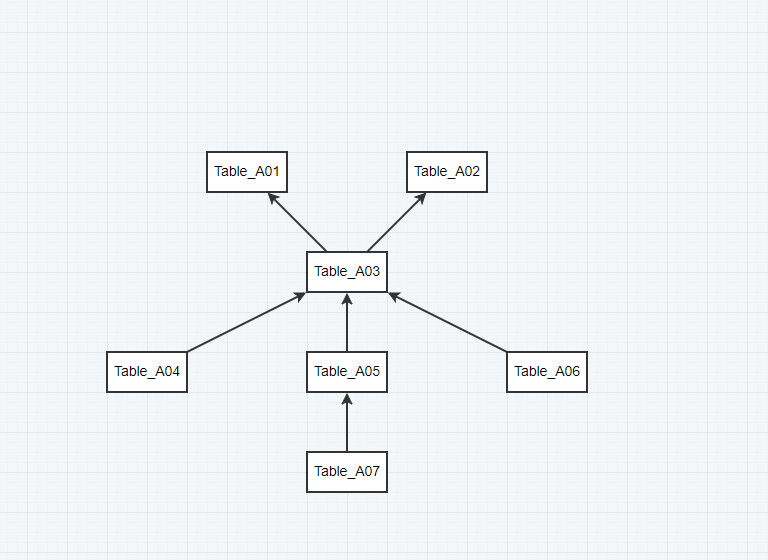
# 1、AntV X6 的 DAG 有向无环图
案例链接 (opens new window) 教程链接 (opens new window) API 链接 (opens new window)  代码实现:
1、安装 Antv X6 包
npm install @antv/x6 --save
1
2、代码实现:
<template>
  <div style="width=100%; height=100%">
    <div id="container"></div>
  </div>
</template>
<script lang="ts">
import { Graph } from "@antv/x6";
// import { Snapline } from '@antv/x6-plugin-snapline'
import { onMounted } from "vue";
import { nodes, edges } from "./data";
export default {
  setup() {
    onMounted(() => {
      const graph = new Graph({
        container: document.getElementById("container"),
        //画布大小自适应
        autoResize: true,
        width: 800,
        height: 600,
        // 通过 background 和 grid 两个配置来设置画布的背景以及网格。
        background: {
          color: "#F2F7FA",
        },
        grid: {
          visible: true,
          type: "doubleMesh",
          args: [
            {
              color: "#eee", // 主网格线颜色
              thickness: 1, // 主网格线宽度
            },
            {
              color: "#ddd", // 次网格线颜色
              thickness: 1, // 次网格线宽度
              factor: 4, // 主次网格线间隔
            },
          ],
        },
        // panning,mousewheel实现画布的平移和缩放
        panning: true,
        // mousewheel: true,
        mousewheel: {
          enabled: true,
          modifiers: "Ctrl",
        },
      });
      const obj = {};
      nodes.forEach((item) => {
        item.shape = "rect";
        item.width = 80;
        item.height = 40;
        obj[item.label] = graph.addNode(item);
      });
      edges.forEach((item) => {
        item.shape = "edge";
        item.source = obj[item.source];
        item.target = obj[item.target];
        graph.addEdge(item);
      });
    });
  },
};
</script>
1
2
3
4
5
6
7
8
9
10
11
12
13
14
15
16
17
18
19
20
21
22
23
24
25
26
27
28
29
30
31
32
33
34
35
36
37
38
39
40
41
42
43
44
45
46
47
48
49
50
51
52
53
54
55
56
57
58
59
60
61
62
63
2
3
4
5
6
7
8
9
10
11
12
13
14
15
16
17
18
19
20
21
22
23
24
25
26
27
28
29
30
31
32
33
34
35
36
37
38
39
40
41
42
43
44
45
46
47
48
49
50
51
52
53
54
55
56
57
58
59
60
61
62
63
data.js
export const nodes = [
  {
    x: 100,
    y: 200,
    label: "Table_A01",
    id: "Table_A01",
  },
  {
    x: 300,
    y: 200,
    label: "Table_A02",
    id: "Table_A02",
  },
  {
    x: 200,
    y: 300,
    label: "Table_A03",
    id: "Table_A03",
  },
  {
    x: 0,
    y: 400,
    label: "Table_A04",
    id: "Table_A04",
  },
  {
    x: 200,
    y: 400,
    label: "Table_A05",
    id: "Table_A05",
  },
  {
    x: 400,
    y: 400,
    label: "Table_A06",
    id: "Table_A06",
  },
  {
    x: 200,
    y: 500,
    label: "Table_A07",
    id: "Table_A07",
  },
];
export const edges = [
  {
    source: "Table_A03",
    target: "Table_A01",
  },
  {
    source: "Table_A03",
    target: "Table_A02",
  },
  {
    source: "Table_A04",
    target: "Table_A03",
  },
  {
    source: "Table_A05",
    target: "Table_A03",
  },
  {
    source: "Table_A06",
    target: "Table_A01",
  },
  {
    source: "Table_A07",
    target: "Table_A05",
  },
];
1
2
3
4
5
6
7
8
9
10
11
12
13
14
15
16
17
18
19
20
21
22
23
24
25
26
27
28
29
30
31
32
33
34
35
36
37
38
39
40
41
42
43
44
45
46
47
48
49
50
51
52
53
54
55
56
57
58
59
60
61
62
63
64
65
66
67
68
69
70
2
3
4
5
6
7
8
9
10
11
12
13
14
15
16
17
18
19
20
21
22
23
24
25
26
27
28
29
30
31
32
33
34
35
36
37
38
39
40
41
42
43
44
45
46
47
48
49
50
51
52
53
54
55
56
57
58
59
60
61
62
63
64
65
66
67
68
69
70
缺点:每一个节点的渲染都需要确定的 X,Y 轴坐标信息,而后端无法提供坐标位置信息。这个技术更适合去实现流程图画图工具
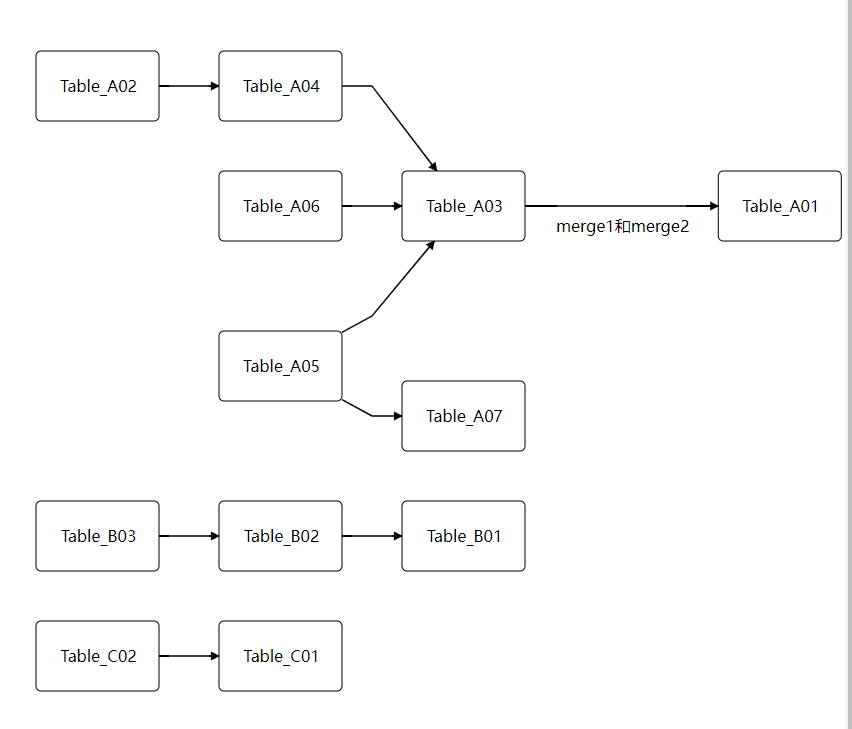
# 2、通过 D3 实现流程图
1、安装 D3 依赖包
npm install d3
npm install dagre-d3
1
2
2
代码:
<template>
  <div style="border: 1px solid #ccc; padding: 20px; width: 600px">
    <svg class="dagre" width="1600" height="1000">
      <g class="container"></g>
    </svg>
  </div>
  <!-- <div ref="tooltip" class="tooltip">
        <div>节点ID:{{ currentNode.id }}</div>
        <div>节点名称:{{ currentNode.nodeName }}</div>
    </div> -->
</template>
<script lang="ts" setup>
import { onMounted } from "vue";
import { dataSet } from "./data";
import dagreD3 from "dagre-d3";
import * as d3 from "d3";
// 设置节点和连线
let tooltip;
const renderGagre = () => {
  tooltip = createTooltip();
  // 创建graph对象
  console.log(dataSet);

  const g = new dagreD3.graphlib.Graph();
  // 设置图
  g.setGraph({
    rankdir: "LR", // T:top B:bottom
    marginx: 60,
    marginy: 80,
    edgesep: 100,
    ranksep: 60,
  });
  dataSet.nodes.forEach((item) => {
    g.setNode(item.id, {
      // 节点标签
      label: item.label,
      // 节点形状
      shape: item.shape || "rect", ////节点形状,可以设置rect(长方形),circle,ellipse(椭圆),diamond(菱形) 四种形状,还可以使用render.shapes()自定义形状
      toolText: item.toolText,
      // 节点样式
      style: item.color ? item.color : "fill:#FFFFFF;stroke:#000000", //节点样式,可设置节点的颜色填充、节点边框
      labelStyle: "fill:#000000;", //节点标签样式, 可设置节点标签的文本样式(颜色、粗细、大小)
      width: 83,
      height: 40,
      rx: 5, // 设置圆角
      ry: 5, // 设置圆角
      paddingBottom: 15,
      paddingLeft: 20,
      paddingRight: 20,
      paddingTop: 15,
    });
  });
  dataSet.edges.forEach((item) => {
    g.setEdge(item.source, item.target, {
      // 边标签
      label: item.label,
      arrowheadStyle: item.color ? item.color : "fill:#000000;", // 根据后台数据来改变连线箭头的颜色
      // 边样式
      style: item.color
        ? item.color
        : "fill:#ffffff;stroke:#000000;stroke-width:1.5px", // 根据后台数据来改变连线的颜色
      // arrowhead: 'normal', //箭头形状,可以设置 normal,vee,undirected 三种样式,默认为 normal
    });
  });
  // 创建渲染器
  const render = new dagreD3.render();
  // 选择svg并添加一个g元素作为绘图容器
  const svgGroup = d3.select("svg.dagre").append("g");
  // 建立拖拽缩放
  const svg = d3.select("svg.dagre");
  const zoom = d3.zoom().on("zoom", function (current) {
    svgGroup.attr("transform", current.transform);
  });
  // let zoom = d3
  //     .zoom()
  //     .scaleExtent([0.5, 2])
  //     .on('zoom', function (current) {
  //         svgGroup.attr('transform', current.transform)
  //     })
  svg.call(zoom);

  // 在绘图容器上运行渲染器生成流程图
  render(svgGroup, g);

  // 鼠标悬停显示隐藏tooptip
  console.log(svgGroup.selectAll("g.node"));

  svgGroup
    .selectAll("g.node")
    .on("mouseover", (v) => {
      // debugger
      console.log(v, "v");
      console.log(g.node(v), "g.node(v)");
      console.log(g.node(), "g.node()");

      // 假如当前toolText为"",则不展示
      if (g.node(v).toolText === "") {
        return;
      }
      tipVisible(g.node(v).toolText);
    })
    .on("mouseout", () => {
      tipHidden();
    });
  // const currentNode = {
  //     id: null,
  //     nodeName: '',
  // }
  // const that = this
  // const tooltipBox = that.$refs.tooltip
  // svgGroup
  //     .on('mouseover', (e) => {
  //         currentNode = that.nodes.filter(
  //             (item) => item.id === Number(e.target.__data__)
  //         )[0]
  //         tooltipBox.style.display = 'block'
  //         tooltipBox.style.top = e.clientY + 20 + 'px'
  //         tooltipBox.style.left = e.clientX + 'px'
  //     })
  //     .on('mouseout', function () {
  //         tooltipBox.style.display = 'none'
  //     })
};
const createTooltip = () => {
  return d3
    .select("body")
    .append("div")
    .classed("tooltip", true)
    .style("opacity", 0)
    .style("display", "none");
};
// tooltip显示
const tipVisible = (textContent) => {
  tooltip
    .transition()
    .duration(400)
    .style("opacity", 0.9)
    .style("display", "block");
  tooltip
    .html(textContent)
    .style("left", `${d3.event.pageX + 15}px`)
    .style("top", `${d3.event.pageY + 15}px`);
};
// tooltip隐藏
const tipHidden = () => {
  tooltip
    .transition()
    .duration(400)
    .style("opacity", 0)
    .style("display", "none");
};
onMounted(() => {
  renderGagre();
});
</script>
<style scoped>
.tooltip {
  position: absolute;
  font-size: 12px;
  text-align: center;
  background-color: white;
  border-radius: 3px;
  box-shadow: rgb(174, 174, 174) 0px 0px 10px;
  cursor: pointer;
  display: inline-block;
  padding: 10px;
}

.tooltip > div {
  padding: 10px;
}
</style>
1
2
3
4
5
6
7
8
9
10
11
12
13
14
15
16
17
18
19
20
21
22
23
24
25
26
27
28
29
30
31
32
33
34
35
36
37
38
39
40
41
42
43
44
45
46
47
48
49
50
51
52
53
54
55
56
57
58
59
60
61
62
63
64
65
66
67
68
69
70
71
72
73
74
75
76
77
78
79
80
81
82
83
84
85
86
87
88
89
90
91
92
93
94
95
96
97
98
99
100
101
102
103
104
105
106
107
108
109
110
111
112
113
114
115
116
117
118
119
120
121
122
123
124
125
126
127
128
129
130
131
132
133
134
135
136
137
138
139
140
141
142
143
144
145
146
147
148
149
150
151
152
153
154
155
156
157
158
159
160
161
162
163
164
165
166
167
168
169
170
171
172
data.js
export const dataSet = {
  nodes: [
    {
      id: "Table_A01",
      label: "Table_A01",
      shape: "rect",
      // color: 'fill:#d81b13;stroke:transparent',
      toolText: "111",
    },
    {
      id: "Table_A02",
      label: "Table_A02",
      shape: "rect",
      color: "",
      toolText: "",
    },
    {
      id: "Table_A03",
      label: "Table_A03",
      shape: "rect",
      color: "",
      toolText: "",
    },
    {
      id: "Table_A04",
      label: "Table_A04",
      shape: "rect",
      color: "",
      toolText: "",
    },
    {
      id: "Table_A05",
      label: "Table_A05",
      shape: "rect",
      color: "",
      toolText: "",
    },
    {
      id: "Table_A06",
      label: " Table_A06 ",
      shape: "rect",
      color: "",
      toolText: "",
    },
    {
      id: "Table_A07",
      label: " Table_A07 ",
      shape: "rect",
      color: "",
      toolText: "",
    },
    {
      id: "Table_B01",
      label: " Table_B01 ",
      shape: "rect",
      color: "",
      toolText: "",
    },
    {
      id: "Table_B02",
      label: " Table_B02 ",
      shape: "rect",
      color: "",
      toolText: "",
    },
    {
      id: "Table_B03",
      label: " Table_B03 ",
      shape: "rect",
      color: "",
      toolText: "",
    },
    {
      id: "Table_C01",
      label: " Table_C01 ",
      shape: "rect",
      color: "",
      toolText: "",
    },
    {
      id: "Table_C02",
      label: " Table_C02 ",
      shape: "rect",
      color: "",
      toolText: "",
    },
  ],
  edges: [
    {
      id: 1,
      source: "Table_A03",
      target: "Table_A01",
      label: "merge1和merge2",
      color: "",
    },
    {
      id: 1,
      source: "Table_A02",
      target: "Table_A04",
      label: "",
      color: "",
    },
    {
      id: 1,
      source: "Table_A04",
      target: "Table_A03",
      label: "",
      color: "",
    },
    {
      id: 1,
      source: "Table_A06",
      target: "Table_A03",
      label: "",
      color: "",
    },
    {
      id: 1,
      source: "Table_A05",
      target: "Table_A03",
      label: "",
      color: "",
    },
    {
      id: 1,
      source: "Table_A05",
      target: "Table_A07",
      label: "",
      color: "",
    },
    {
      id: 1,
      source: "Table_B02",
      target: "Table_B01",
      label: "",
      color: "",
    },
    {
      id: 1,
      source: "Table_B03",
      target: "Table_B02",
      label: "",
      color: "",
    },
    {
      id: 1,
      source: "Table_C02",
      target: "Table_C01",
      label: "",
      color: "",
    },
    // { id: 2, source: 1, target: 4, label: '', color: '' },
    // { id: 3, source: 2, target: 3, label: '', color: '' },
    // { id: 4, source: 5, target: 1, label: '', color: '' },
    // { id: 5, source: 4, target: 5, label: '', color: '' },
    // { id: 6, source: 2, target: 5, label: '', color: '' },
  ],
};
1
2
3
4
5
6
7
8
9
10
11
12
13
14
15
16
17
18
19
20
21
22
23
24
25
26
27
28
29
30
31
32
33
34
35
36
37
38
39
40
41
42
43
44
45
46
47
48
49
50
51
52
53
54
55
56
57
58
59
60
61
62
63
64
65
66
67
68
69
70
71
72
73
74
75
76
77
78
79
80
81
82
83
84
85
86
87
88
89
90
91
92
93
94
95
96
97
98
99
100
101
102
103
104
105
106
107
108
109
110
111
112
113
114
115
116
117
118
119
120
121
122
123
124
125
126
127
128
129
130
131
132
133
134
135
136
137
138
139
140
141
142
143
144
145
146
147
148
149
150
151
152
153
154
155
156
157
158
缺点:对于需求中的部分功能无法实现:比如点击或者悬浮在边节点时,无法展示边连接的字段信息
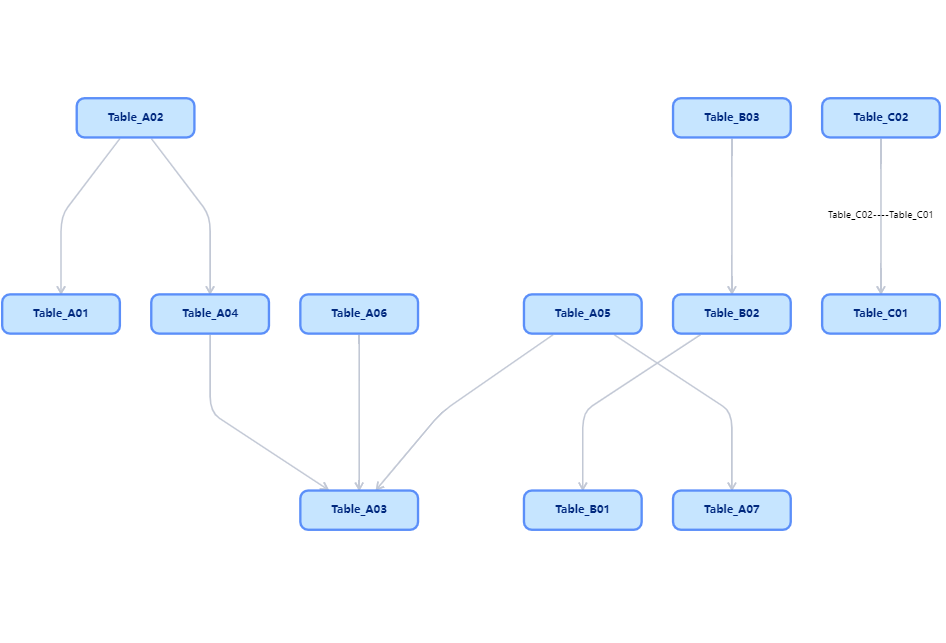
# 3、通过 AntV G6 实现流程图
案例链接 (opens new window) 教程链接 (opens new window) API 链接 (opens new window) 
<template>
  <div style="width=100%; height=100%;margin-left:20px;overflow-x: auto;">
    <div id="container"></div>
  </div>
</template>
<script lang="ts" setup>
import G6 from "@antv/g6";
import { onMounted } from "vue";
import { G6Data } from "./data";
const renderDAG = () => {
  if (this.charts) {
    this.charts.destroy();
  }
  // 自定义节点
  G6.registerNode(
    "sql",
    {
      drawShape(cfg, group) {
        const rect = group.addShape("rect", {
          attrs: {
            x: -75,
            y: -25,
            width: 150,
            height: 50,
            radius: 10,
            stroke: "#5B8FF9",
            fill: "#C6E5FF",
            lineWidth: 3,
          },
          name: "rect-shape",
        });
        if (cfg.name) {
          group.addShape("text", {
            attrs: {
              text: cfg.name,
              x: 0,
              y: 0,
              fill: "#00287E",
              fontSize: 14,
              textAlign: "center",
              textBaseline: "middle",
              fontWeight: "bold",
            },
            name: "text-shape",
          });
        }
        return rect;
      },
    },
    "single-node"
  );
  const container = document.getElementById("container");
  // const width = container.scrollWidth || 800
  // const height = container.scrollHeight || 800
  const graph = new G6.Graph({
    container: "container",
    width: 960,
    height: 800,
    layout: {
      type: "dagre",
      nodesepFunc: (d) => {
        if (d.id === "3") {
          return 500;
        }
        return 50;
      },
      ranksep: 70,
      controlPoints: true,
    },
    //默认情况下全局节点的配置项,包括样式属性和其他属性
    defaultNode: {
      type: "sql",
    },
    // 默认情况下全局边的配置项,包括样式属性和其他属性
    defaultEdge: {
      type: "polyline",
      style: {
        radius: 20,
        offset: 45,
        endArrow: true,
        lineWidth: 2,
        stroke: "#C2C8D5",
      },
    },
    // 除默认状态外的其他状态下节点的样式配置
    nodeStateStyles: {
      selected: {
        stroke: "#d9d9d9",
        fill: "#5394ef",
      },
      highlight: {
        fill: "#db4437",
        shadowColor: "#fff",
        stroke: "#db4437",
        cursor: "pointer",
        "text-shape": {
          lineWidth: 1,
          fill: "#db4437",
          stroke: "#db4437",
        },
      },
    },
    edgeStateStyles: {}, // 配置边状态样式
    comboStateStyles: {}, // 配置分组状态样式
    // 配置多种交互模式及其包含的交互事件的
    modes: {
      default: [
        "drag-canvas",
        "zoom-canvas",
        "click-select",
        {
          type: "activate-relations",
          activeState: "active",
          inactiveState: "inactive",
        },
        {
          type: "tooltip", // 节点提示框
          formatText(model) {
            // const cfg = model.conf
            // const text = []
            // cfg.forEach((row) => {
            //     text.push(
            //         row.label + ':' + row.value + '<br>'
            //     )
            // })
            // return text.join('\n')
            return model.suspended;
          },
          offset: 50,
        },
        {
          type: "edge-tooltip", // 边提示框
          formatText(model) {
            // 边提示框文本内容
            return model.suspended;
          },
        },
      ],
    },
    fitView: true,
  });
  console.log(G6Data);

  // graph.destroy()
  this.charts = graph;
  graph.data(G6Data);
  graph.render();
  graph.on("combo:mouseenter", (e) => {
    let edgeItem = e.item;
    graph.setItemState(edgeItem, "highlight", true);
    edgeItem.getEdges().forEach((edge) => {
      graph.setItemState(edge.getTarget(), "highlight", true);
      graph.setItemState(edge.getSource(), "highlight", true);
      graph.setItemState(edge, "highlight", true);
    });
    graph.paint();
    graph.setAutoPaint(true);
  });

  graph.on("combo:mouseleave", (e) => {
    graph.setAutoPaint(false);
    graph.getNodes().forEach((node) => {
      graph.clearItemStates(node);
    });
    graph.getEdges().forEach((edge) => {
      graph.clearItemStates(edge);
    });
    graph.getCombos().forEach((combo) => {
      graph.clearItemStates(combo);
    });
    graph.paint();
    graph.setAutoPaint(true);
  });
};
onMounted(() => {
  renderDAG();
});
</script>
1
2
3
4
5
6
7
8
9
10
11
12
13
14
15
16
17
18
19
20
21
22
23
24
25
26
27
28
29
30
31
32
33
34
35
36
37
38
39
40
41
42
43
44
45
46
47
48
49
50
51
52
53
54
55
56
57
58
59
60
61
62
63
64
65
66
67
68
69
70
71
72
73
74
75
76
77
78
79
80
81
82
83
84
85
86
87
88
89
90
91
92
93
94
95
96
97
98
99
100
101
102
103
104
105
106
107
108
109
110
111
112
113
114
115
116
117
118
119
120
121
122
123
124
125
126
127
128
129
130
131
132
133
134
135
136
137
138
139
140
141
142
143
144
145
146
147
148
149
150
151
152
153
154
155
156
157
158
159
160
161
162
163
164
165
166
167
168
169
170
171
172
173
174
175
176
177
178
data.js
export const G6Data = {
  nodes: [
    {
      id: "Table_A01",
      // dataType: 'alps',
      name: "Table_A01",
      suspended: "士大夫随风倒",
    },
    {
      id: "Table_A02",
      // dataType: 'alps',
      name: "Table_A02",
      suspended: "士大夫随风倒",
    },
    {
      id: "Table_A03",
      // dataType: 'alps',
      name: "Table_A03",
      suspended: "士大夫随风倒",
    },
    {
      id: "Table_A04",
      // dataType: 'sql',
      name: "Table_A04",
      suspended: "士大夫随风倒",
    },
    {
      id: "Table_A05",
      // dataType: 'sql',
      name: "Table_A05",
      suspended: "士大夫随风倒",
    },
    {
      id: "Table_A06",
      // dataType: 'feature_etl',
      name: "Table_A06",
      suspended: "士大夫随风倒",
    },
    {
      id: "Table_A07",
      // dataType: 'feature_etl',
      name: "Table_A07",
      suspended: "士大夫随风倒",
    },
    {
      id: "Table_B01",
      // dataType: 'feature_extractor',
      name: "Table_B01",
      conf: [
        {
          label: "conf",
          value: "pai_graph.conf",
        },
        {
          label: "dot",
          value: "pai_graph.dot",
        },
        {
          label: "init",
          value: "init.rc",
        },
      ],
    },
    {
      id: "Table_B02",
      // dataType: 'feature_extractor',
      name: "Table_B02",
      suspended: "士大夫随风倒",
    },
    {
      id: "Table_B03",
      // dataType: 'feature_extractor',
      name: "Table_B03",
      suspended: "士大夫随风倒",
    },
    {
      id: "Table_C01",
      // dataType: 'feature_extractor',
      name: "Table_C01",
      suspended: "士大夫随风倒",
    },
    {
      id: "Table_C02",
      // dataType: 'feature_extractor',
      name: "Table_C02",
      suspended: "士大夫随风倒",
    },
  ],
  edges: [
    {
      source: "Table_A02",
      target: "Table_A04",
      suspended: "的温热我认为",
    },
    {
      source: "Table_A04",
      target: "Table_A03",
      suspended: "的温热我认为",
    },
    {
      source: "Table_A06",
      target: "Table_A03",
      suspended: "的温热我认为",
    },
    {
      source: "Table_A05",
      target: "Table_A03",
      suspended: "的温热我认为",
    },
    {
      source: "Table_A05",
      target: "Table_A07",
      suspended: "的温热我认为",
    },
    {
      source: "Table_B02",
      target: "Table_B01",
      suspended: "的温热我认为",
    },
    {
      source: "Table_B03",
      target: "Table_B02",
      suspended: "的温热我认为",
    },
    {
      source: "Table_C02",
      target: "Table_C01",
      label: "Table_C02----Table_C01",
      suspended: "的温热我认为",
    },
    {
      source: "Table_A02",
      target: "Table_A01",
      suspended: "所发生的郭德纲",
    },
    {
      source: "Table_A02",
      target: "Table_A01",
      suspended: "所发生的郭德纲",
    },
  ],
};
1
2
3
4
5
6
7
8
9
10
11
12
13
14
15
16
17
18
19
20
21
22
23
24
25
26
27
28
29
30
31
32
33
34
35
36
37
38
39
40
41
42
43
44
45
46
47
48
49
50
51
52
53
54
55
56
57
58
59
60
61
62
63
64
65
66
67
68
69
70
71
72
73
74
75
76
77
78
79
80
81
82
83
84
85
86
87
88
89
90
91
92
93
94
95
96
97
98
99
100
101
102
103
104
105
106
107
108
109
110
111
112
113
114
115
116
117
118
119
120
121
122
123
124
125
126
127
128
129
130
131
132
133
134
135
136
137
138
139
140
141
142
遇到的问题: 1、ref 调取子组件的方法
// vue3写法
const dagImage = ref(null);
dagImage.value.renderDAG(res.data.data);
// vue2写法
this.$refs.dagImage.renderDAG(res.data.data);
1
2
3
4
5
2
3
4
5
2、销毁流程图-变量变为全局变量 父组件采用组合式写法,子组件使用选项式写法,这样子组件的 graph 就可以赋值给全局变量,这样再销毁就可以了
